It’s that time of year again when a highly complex set of GCSE school performance data is reduced to a few chosen metrics and turned into a simplistic set of league tables in which the top schools are venerated and the bottom schools are castigated.
The chosen metrics are usually based on “GCSE or equivalent” qualifications, despite the Govian rhetoric about academic rigour, and “top-performing” academy sponsors are routinely praised by the minister for their magical achievements, despite the fact that a significant portion of their performance metrics are more due to “equivalents” than “GCSEs”.
I’m not criticising equivalents. There are many non-academic teenagers who have benefited from non-GCSE vocational qualifications that have helped them find rewarding employment. We have to separate the debate about whether non-GCSE qualifications are a good thing from the discussion of school performance.
If Gove wants to praise academic rigour, he should praise the community, voluntary aided (VA) and voluntary controlled (VC) schools that deliver it. If he wants to praise academy sponsors, he should praise their creative use of equivalent vocational qualifications.
If Gove wants to celebrate diversity and praise both, that’s fine by me, but it will cost more in school transport if he wants to turn that diversity into real choice, especially in rural areas like mine. If all he sees when he looks at the English school ecosystem is a “blob” he’s overlooking some important patterns.
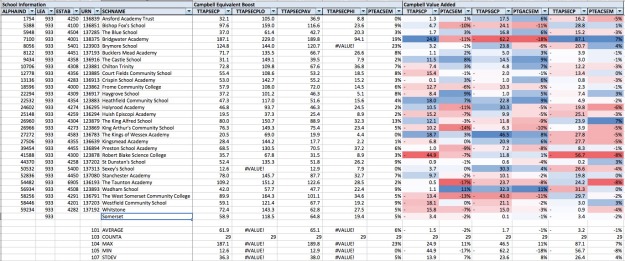
In order to try and untangle the data, I’m going to calculate a set of measures I call the “equivalent boost”. This is the difference between a metric calculated using GCSE and equivalent qualifications and an analogous metric calculated using GCSE only.
My dataset is based on 3,019 mainstream schools (RECTYPE=1) in England that published both key stage 2 average point score (KS2APS) and average capped point score per pupil in best 8 subjects (TTAPSCP) for 2013.
I’m going to highlight some extreme examples of the equivalent boost for analysis and discussion. I’m not automatically suggesting they’re doing anything especially good or bad, but, either way, I think they are especially interesting.
Percentage of pupils achieving 5+ A*-C including A*-C in both English and Maths GCSE
PTEAC5EM = PTAC5EM – PTGAC5EM
The top 11 equivalent boosters get the majority of their percentage from equivalents. 7 of them are sponsored academies.
The average sponsored academy nationally has an equivalent boost of 15%.
| School Name |
Type |
GCSE+
Equivalent |
GCSE
Only |
Equivalent
Boost |
| Moseley Park |
AC |
74%
|
13%
|
61%
|
| Deansfield Community School,
Specialists In Media Arts |
CY |
72%
|
19%
|
53%
|
| Archbishop Sentamu Academy |
AC |
63%
|
13%
|
50%
|
| The Steiner Academy Hereford |
AC |
73%
|
23%
|
50%
|
| Outwood Academy Ripon |
ACC |
71%
|
22%
|
49%
|
| Aylesford School – Sports College |
FD |
59%
|
11%
|
48%
|
| King Edward VI Academy |
AC |
63%
|
23%
|
40%
|
| Ormiston Sir Stanley Matthews Academy |
AC |
72%
|
32%
|
40%
|
| Wilmington Academy |
AC |
71%
|
31%
|
40%
|
| Fyndoune Community College |
CY |
75%
|
36%
|
39%
|
| Abraham Darby Academy |
AC |
61%
|
22%
|
39%
|
The bottom 15 equivalent boosters all have zero boost. 10 are academy converters and 9 have “Grammar” in the name. And, while there are 119 schools in the country with “Grammar” in the name, there are only 15 with zero boost.
The average academy converter has an equivalent boost of 5%.
| School Name |
Type |
GCSE+
Equivalent |
GCSE
Only |
Equivalent
Boost |
| The Blue Coat School |
ACC |
100%
|
100%
|
0%
|
| Urmston Grammar Academy |
ACC |
99%
|
99%
|
0%
|
| Kendrick School |
ACC |
99%
|
99%
|
0%
|
| Torquay Girls Grammar School |
ACC |
99%
|
99%
|
0%
|
| Barton Court Grammar School |
ACC |
99%
|
99%
|
0%
|
| Gravesend Grammar School |
ACC |
99%
|
99%
|
0%
|
| The King’s School, Grantham |
ACC |
99%
|
99%
|
0%
|
| Alcester Grammar School |
ACC |
99%
|
99%
|
0%
|
| The King Edward VI Grammar School,
Louth |
FD |
96%
|
96%
|
0%
|
| Chatham Grammar School for Girls |
ACC |
94%
|
94%
|
0%
|
| Plymouth High School for Girls |
CY |
93%
|
93%
|
0%
|
| Dover Grammar School for Boys |
FD |
92%
|
92%
|
0%
|
| Loreto College |
ACC |
88%
|
88%
|
0%
|
| Batley Grammar School |
F |
81%
|
81%
|
0%
|
| Madani Girls’ School |
VA |
63%
|
63%
|
0%
|
For comparison, the average community school boosts 8%, foundation 9%, VA 5%, and VC 4%.
Average capped point score per pupil in best 8 subjects
TTAPSECP = TTAPSCP – TTAPSGCP
The top 10 equivalent boosters get the majority of their average points from equivalents. Again, 7 out of 10 are sponsored academies.
40 points is equivalent to a grade-C GCSE, so these schools are getting 5 or 6 grade-C GCSE equivalents from non-GCSEs.
The average sponsored academy boosts by 112 points, or almost 3 grade-C GCSEs.
| School Name |
Type |
GCSE+
Equivalent |
GCSE
Only |
Equivalent
Boost |
| Barnfield Skills Academy |
FSS |
344.1
|
78.6
|
265.5
|
| Bolton St Catherine’s Academy |
AC |
351.6
|
107.7
|
243.9
|
| Skegness Academy |
AC |
375.6
|
133.8
|
241.8
|
| Northumberland CofE Academy |
AC |
349.4
|
123.4
|
226.0
|
| North Liverpool Academy |
AC |
363.5
|
137.6
|
225.9
|
| Moseley Park |
AC |
369.3
|
143.8
|
225.5
|
| Aylesford School – Sports College |
FD |
369.7
|
145.9
|
223.8
|
| Brumby Engineering College |
CY |
383.7
|
163.3
|
220.4
|
| Outwood Academy Adwick |
AC |
369.9
|
151.7
|
218.2
|
| The Mirus Academy |
AC |
310.9
|
95.2
|
215.7
|
The bottom 15 equivalent boosters are the same 15 we saw above. The average academy converter boosts by 47 points, or just over 1 grade-C GCSE.
| School Name |
Type |
GCSE+
Equivalent |
GCSE
Only |
Equivalent
Boost |
| Kendrick School |
ACC |
449.6
|
449.6
|
0.0 |
| The Blue Coat School |
ACC |
439.1
|
439.1
|
0.0
|
| Torquay Girls Grammar School |
ACC |
425.4
|
425.4
|
0.0
|
| Alcester Grammar School |
ACC |
423.6
|
423.6
|
0.0
|
| The King’s School, Grantham |
ACC |
407.2
|
407.2
|
0.0
|
| Urmston Grammar Academy |
ACC |
405.3
|
405.3
|
0.0
|
| Barton Court Grammar School |
ACC |
404.2
|
404.2
|
0.0
|
| Gravesend Grammar School |
ACC |
393.1
|
393.1
|
0.0
|
| The King Edward VI Grammar School,
Louth |
FD |
391.3
|
391.3
|
0.0
|
| Plymouth High School for Girls |
CY |
386.6
|
386.6
|
0.0
|
| Chatham Grammar School for Girls |
ACC |
385.6
|
385.6
|
0.0
|
| Loreto College |
ACC |
383.3
|
383.3
|
0.0
|
| Dover Grammar School for Boys |
FD |
367.8
|
367.8
|
0.0
|
| Batley Grammar School |
F |
364.0
|
364.0
|
0.0
|
| Madani Girls’ School |
VA |
355.5
|
355.5
|
0.0
|
Community schools boost 66 points, foundation 74, VA 45, and VC 46.
Value added measure based on the best 8 subjects
B8VAMEA
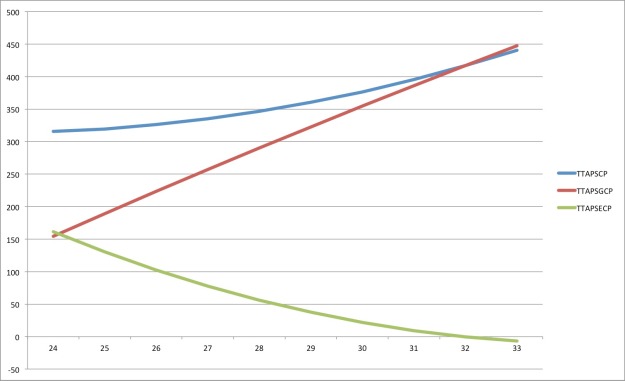
Calculating an equivalent boost for the value-added measure based on the best 8 subjects (B8VAMEA) is more challenging.
B8VAMEA is based on a pupil-level cubic regression of TTAPSCP against KS2APS. I have, however, fairly successfully approximated B8VAMEA using a school-level quadratic regression of TTAPSCP against KS2APS.
I have then calculated value added measures for the GSCE-only TTAPSGCP and equivalent boost TTAPSECP above using similar school-level quadratic regressions. As I have used consistent models for all three measures, the total value added equals the sum of the GCSE-only value added and the equivalent boost value added.
A statistical regression model doesn’t have an opinion. This isn’t a measure of how much a school should be using equivalents; it’s simply a measure of what other schools with similar KS2APS intakes actually do. If the national pattern changes, the model will follow. When I talk of over- and under-boosters, I mean against the model, not my own subjective view.
The 2013 expected equivalent boost model is steeply downward sloping from 161 points at KS2APS=24 to 0 points at KS2APS=32. It has steepened slightly each year since 2011. The equivalent boost value added, therefore, is the excess over that model, and can be negative.
The top 10 overboosters list yet again contains 7 sponsored academies. The average sponsored academy overboosts by 21 points and the average foundation school overboosts by 2 points.
| School Name |
Type |
DfE
Measure |
GCSE+
Equivalent |
GCSE
Only |
Equivalent
Boost |
| King Edward VI Camp Hill
School for Boys |
ACC |
977.4
|
-1.3
|
-156.0
|
154.7
|
| Ormiston Bolingbroke Academy |
AC |
1027.7
|
30.6
|
-119.9
|
150.4
|
| Brumby Engineering College |
CY |
1044.4
|
47.7
|
-97.1
|
144.8
|
| Appleton Academy |
AC |
992.3
|
-1.7
|
-143.5
|
141.9
|
| Outwood Academy Adwick |
AC |
1028.6
|
36.0
|
-102.0
|
138.0
|
| Skegness Academy |
AC |
1048.1
|
50.3
|
-86.2
|
136.5
|
| North Liverpool Academy |
AC |
1033.2
|
34.2
|
-99.3
|
133.5
|
| Bolton St Catherine’s Academy |
AC |
1023.6
|
27.8
|
-105.5
|
133.3
|
| Moseley Park |
AC |
1044.5
|
40.9
|
-89.8
|
130.6
|
| Parkside Academy |
ACC |
1064.1
|
66.4
|
-55.4
|
121.7
|
To give some context here, Ormiston Bolingbroke Academy is in a tough area of Runcorn and is the successor to at least three previous failed schools, Halton Priory, Brookvale Comprehensive, and Halton High.
The fact that Ormiston Bolingbroke gets the results it does is a real achievement, when compared to its predecessors.
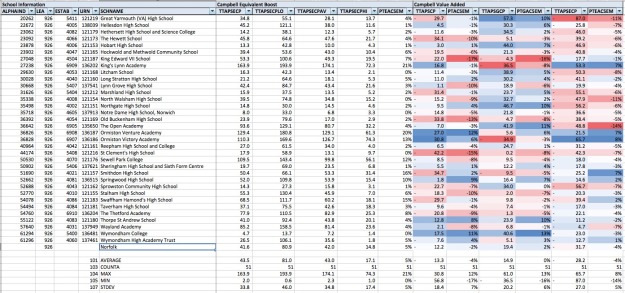
The top 10 underboosters include four community schools. The average community school underboosts by 2 points, as does the average academy converter.
The average VA school underboosts by 10 points, and the average VC school underboosts by 14.
| School Name |
Type |
DfE
Measure |
GCSE+
Equivalent |
GCSE
Only |
Equivalent
Boost |
| St Mary’s Catholic High School |
VA |
990.0
|
-28.4
|
79.6
|
-108.0
|
| George Mitchell School |
CY |
997.5
|
-9.4
|
92.5
|
-101.9
|
| Abraham Moss
Community School |
CY |
976.4
|
-23.6
|
77.0
|
-100.6
|
| Manchester Health Academy |
AC |
957.6
|
-50.0
|
50.1
|
-100.1
|
| Beacon Hill Community School |
CY |
961.1
|
-40.9
|
53.5
|
-94.4
|
| Stephenson Studio School |
FSS |
955.1
|
-53.7
|
36.3
|
-90.0
|
| Whitmore High School |
CY |
1,013.6
|
13.6
|
103.0
|
-89.4
|
| St Michael’s Catholic
Secondary School |
F |
956.5
|
-76.4
|
11.3
|
-87.8
|
| Great Yarmouth (VA) High School |
VA |
974.6
|
-29.7
|
57.3
|
-87.0
|
| Oxford Spires Academy |
AC |
1,012.5
|
8.4
|
94.4
|
-86.0
|
I don’t know if Oxford Spires Academy’s appearance in this list will interest Warwick Mansell, given that he recently mentioned them in an article for The Guardian.
http://www.theguardian.com/education/2014/jan/21/gcse-pupils-disappearing-from-school-rolls
My concern here is that what these statistics show is the divergence of English schools into a two-tier self-selective system with “secondary post-moderns” overusing GCSE equivalent qualifications and “neogrammars” underusing them.
If money in local authorities continues to be tight, as it is here in Suffolk, free home-to-school transport may only be offered to the nearest school, and whether you end up going to a comprehensive, neogrammar or secondary post-modern may be a function of where you live, rather than your ability.
The equivalent boost has consequences and deserves investigating. DfE should include a GCSE-only value added measure in its performance tables.